Quickstart
Siuba is a tool for concise, flexible data-analysis over multiple data sources. It currently supports pandas DataFrames and SQL tables.
Installing
pip install siuba
Basic use
The code below uses the example DataFrame mtcars, to get the average horsepower (hp) per cylinder.
[2]:
from siuba import _, group_by, summarize
from siuba.data import mtcars

(mtcars
  >> group_by(_.cyl)
  >> summarize(avg_hp = _.hp.mean())
  )
[2]:
| cyl | avg_hp | |
|---|---|---|
| 0 | 4 | 82.636364 |
| 1 | 6 | 122.285714 |
| 2 | 8 | 209.214286 |
There are three key concepts in this example:
concept |
example |
meaning |
|---|---|---|
verb |
|
a function that operates on a table, like a DataFrame or SQL table |
lazy expression |
|
an expression created with |
pipe |
|
a syntax that allows you to chain verbs with the |
Lazy expressions (_)
A siu expression is a way of specifying what action you want to perform. This allows siuba verbs to decide how to execute the action, depending on whether your data is a local DataFrame or remote table.
[3]:
from siuba import _

_.cyl == 4
[3]:
█─==
├─█─.
│ ├─_
│ └─'cyl'
└─4
Notice how the output represents each step in our lazy expression, with these pieces:
black box █ - a method like checking equality (
==) or getting an attribute (.).underscore (
_) - a placeholder for a table of data.
We can use these expressions like lambda functions. For example, to keep specific rows of a pandas DataFrame.
[4]:
# old approach: repeat name
mtcars[mtcars.cyl == 4]

# old approach: lambda
mtcars[lambda _: _.cyl == 4]

# siu approach
mtcars[_.cyl == 4]
[4]:
| mpg | cyl | disp | hp | drat | wt | qsec | vs | am | gear | carb | |
|---|---|---|---|---|---|---|---|---|---|---|---|
| 2 | 22.8 | 4 | 108.0 | 93 | 3.85 | 2.320 | 18.61 | 1 | 1 | 4 | 1 |
| 7 | 24.4 | 4 | 146.7 | 62 | 3.69 | 3.190 | 20.00 | 1 | 0 | 4 | 2 |
| ... | ... | ... | ... | ... | ... | ... | ... | ... | ... | ... | ... |
| 27 | 30.4 | 4 | 95.1 | 113 | 3.77 | 1.513 | 16.90 | 1 | 1 | 5 | 2 |
| 31 | 21.4 | 4 | 121.0 | 109 | 4.11 | 2.780 | 18.60 | 1 | 1 | 4 | 2 |
11 rows × 11 columns
Note that like the lambda function, siuba avoids typing the same (potentially_very_long) name twice, while also being a bit shorter.
Here is a more complex example, that uses grouping and calculating a mean with the pandas groupby and apply methods.
[5]:
# group by cylinder, calculate horse power (hp) minus its mean
(mtcars
  .groupby("cyl")
  .apply(_.hp - _.hp.mean())
)
[5]:
cyl
4    2      10.363636
     7     -20.636364
              ...
8    28     54.785714
     30    125.785714
Name: hp, Length: 32, dtype: float64
Verbs: mutate, filter, summarize
Verbs a functions that operate on a table of data. They can be combined using a pipe with the >> operator.
The previous example can be re-written in siuba as the following.
[6]:
from siuba import mutate

(mtcars
  >> group_by(_.cyl)
  >> mutate(demeaned = _.hp - _.hp.mean())
  )
[6]:
(grouped data frame)
| mpg | cyl | disp | hp | drat | wt | qsec | vs | am | gear | carb | demeaned | |
|---|---|---|---|---|---|---|---|---|---|---|---|---|
| 0 | 21.0 | 6 | 160.0 | 110 | 3.90 | 2.620 | 16.46 | 0 | 1 | 4 | 4 | -12.285714 |
| 1 | 21.0 | 6 | 160.0 | 110 | 3.90 | 2.875 | 17.02 | 0 | 1 | 4 | 4 | -12.285714 |
| ... | ... | ... | ... | ... | ... | ... | ... | ... | ... | ... | ... | ... |
| 30 | 15.0 | 8 | 301.0 | 335 | 3.54 | 3.570 | 14.60 | 0 | 1 | 5 | 8 | 125.785714 |
| 31 | 21.4 | 4 | 121.0 | 109 | 4.11 | 2.780 | 18.60 | 1 | 1 | 4 | 2 | 26.363636 |
32 rows × 12 columns
Note that there is a key difference: mutate returned a pandas DataFrame with the new column (demeaned) at the end. This is a core feature of siuba verbs–tables in and tables out.
Below are examples of keeping certain rows with filter, and calculating a single number per group with summarize.
[7]:
from siuba import filter, summarize

g_cyl = group_by(mtcars, _.cyl)

# keep lowest hp per group
g_cyl >> filter(_.hp == _.hp.min())
[7]:
(grouped data frame)
| mpg | cyl | disp | hp | drat | wt | qsec | vs | am | gear | carb | |
|---|---|---|---|---|---|---|---|---|---|---|---|
| 5 | 18.1 | 6 | 225.0 | 105 | 2.76 | 3.460 | 20.22 | 1 | 0 | 3 | 1 |
| 18 | 30.4 | 4 | 75.7 | 52 | 4.93 | 1.615 | 18.52 | 1 | 1 | 4 | 2 |
| 21 | 15.5 | 8 | 318.0 | 150 | 2.76 | 3.520 | 16.87 | 0 | 0 | 3 | 2 |
| 22 | 15.2 | 8 | 304.0 | 150 | 3.15 | 3.435 | 17.30 | 0 | 0 | 3 | 2 |
[8]:
g_cyl >> summarize(avg_hp = _.hp.mean())
[8]:
| cyl | avg_hp | |
|---|---|---|
| 0 | 4 | 82.636364 |
| 1 | 6 | 122.285714 |
| 2 | 8 | 209.214286 |
Working with SQL
Up to this point we’ve covered lazy expressions (_), and using table verbs. A major benefit of these two approaches is that they allow us to change how siuba behaves depending on the data source on which it is operating.
For this example we first need to set up a SQL database.
[9]:
from sqlalchemy import create_engine
from siuba.sql import LazyTbl

# copy in to sqlite
engine = create_engine("sqlite:///:memory:")
mtcars.to_sql("mtcars", engine, if_exists = "replace")
[9]:
32
Now we can use summarize as above.
[10]:
# connect with siuba
tbl_mtcars = LazyTbl(engine, "mtcars")

(tbl_mtcars
  >> group_by(_.cyl)
  >> summarize(avg_hp = _.hp.mean())
  )
[10]:
# Source: lazy query
# DB Conn: Engine(sqlite:///:memory:)
# Preview:
| cyl | avg_hp | |
|---|---|---|
| 0 | 4 | 82.636364 |
| 1 | 6 | 122.285714 |
| 2 | 8 | 209.214286 |
# .. may have more rows
Under the hood siuba’s summarize function is converting the lazy expression show in the code below to SQL.
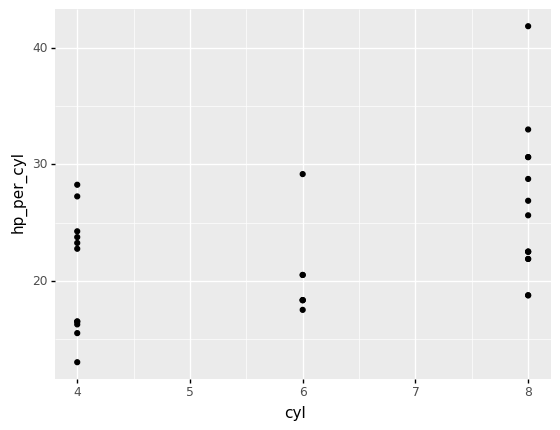
Using with plotnine
Fortnuately, plotnine supports siuba’s style of piping, so is easy to plug in to!
[11]:
from siuba import mutate, _
from plotnine import ggplot, aes, geom_point

(mtcars
  >> mutate(hp_per_cyl = _.hp / _.cyl)
  >> ggplot(aes("cyl", "hp_per_cyl"))
   + geom_point()
)
/home/docs/checkouts/readthedocs.org/user_builds/siuba/envs/docs/lib/python3.9/site-packages/scipy/__init__.py:146: UserWarning: A NumPy version >=1.16.5 and <1.23.0 is required for this version of SciPy (detected version 1.23.0
[11]:
<ggplot: (8760431686909)>
Next steps
Interested in wrangling data right away? Check out the data analysis guide.
Curious how to program and extend siuba? Check out the programming guide.
Edit page on github here.
Interactive version:
![]()
